


The problem was not that the trees were unmapped. The problem was that the maps were not made for the way people actually experience a city. If someone wants to find a beautiful spring walk, they are not thinking in terms of municipal tree inventories, ArcGIS layers, species fields, or agency datasets. They are asking much simpler questions:
Where can I go that is blooming? What is near me? Is there somewhere pretty that is not completely packed?
The answers existed, but only in fragments. D.C. street trees lived in one dataset. National Park Service cherry trees lived somewhere else. The Arboretum and Arlington had their own records. Tulip spots were recommended on blogs but never aggregated. So the real challenge became translation: taking scattered public data, cleaning and combining it, then turning it into a joyful map that people could actually open, use, and enjoy.
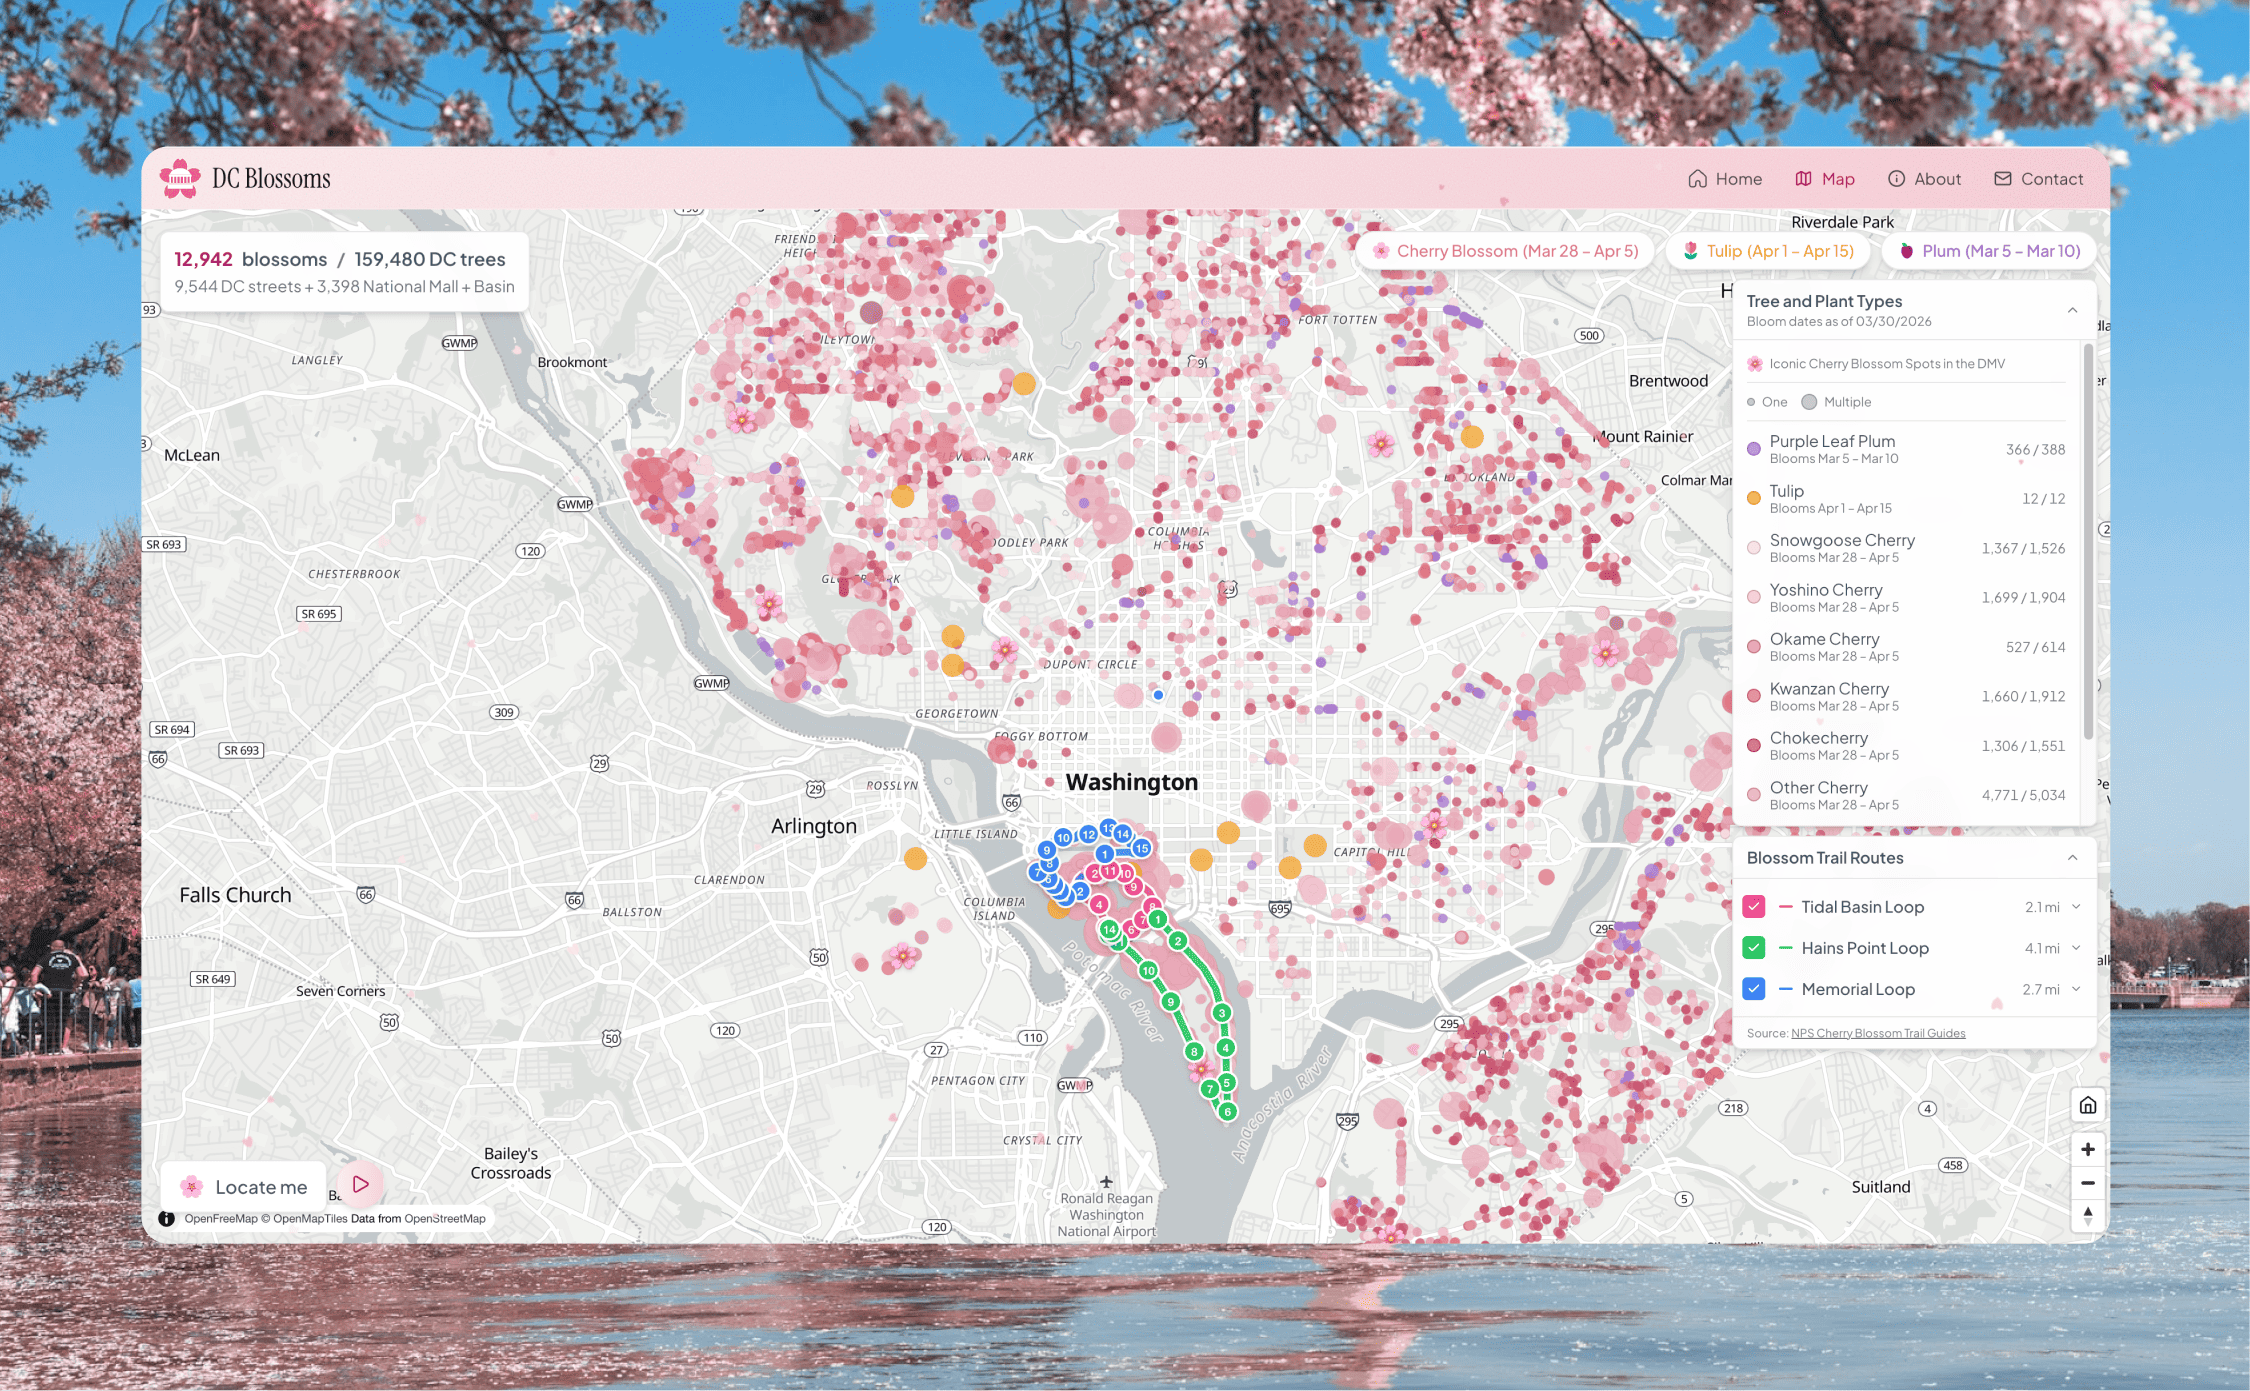
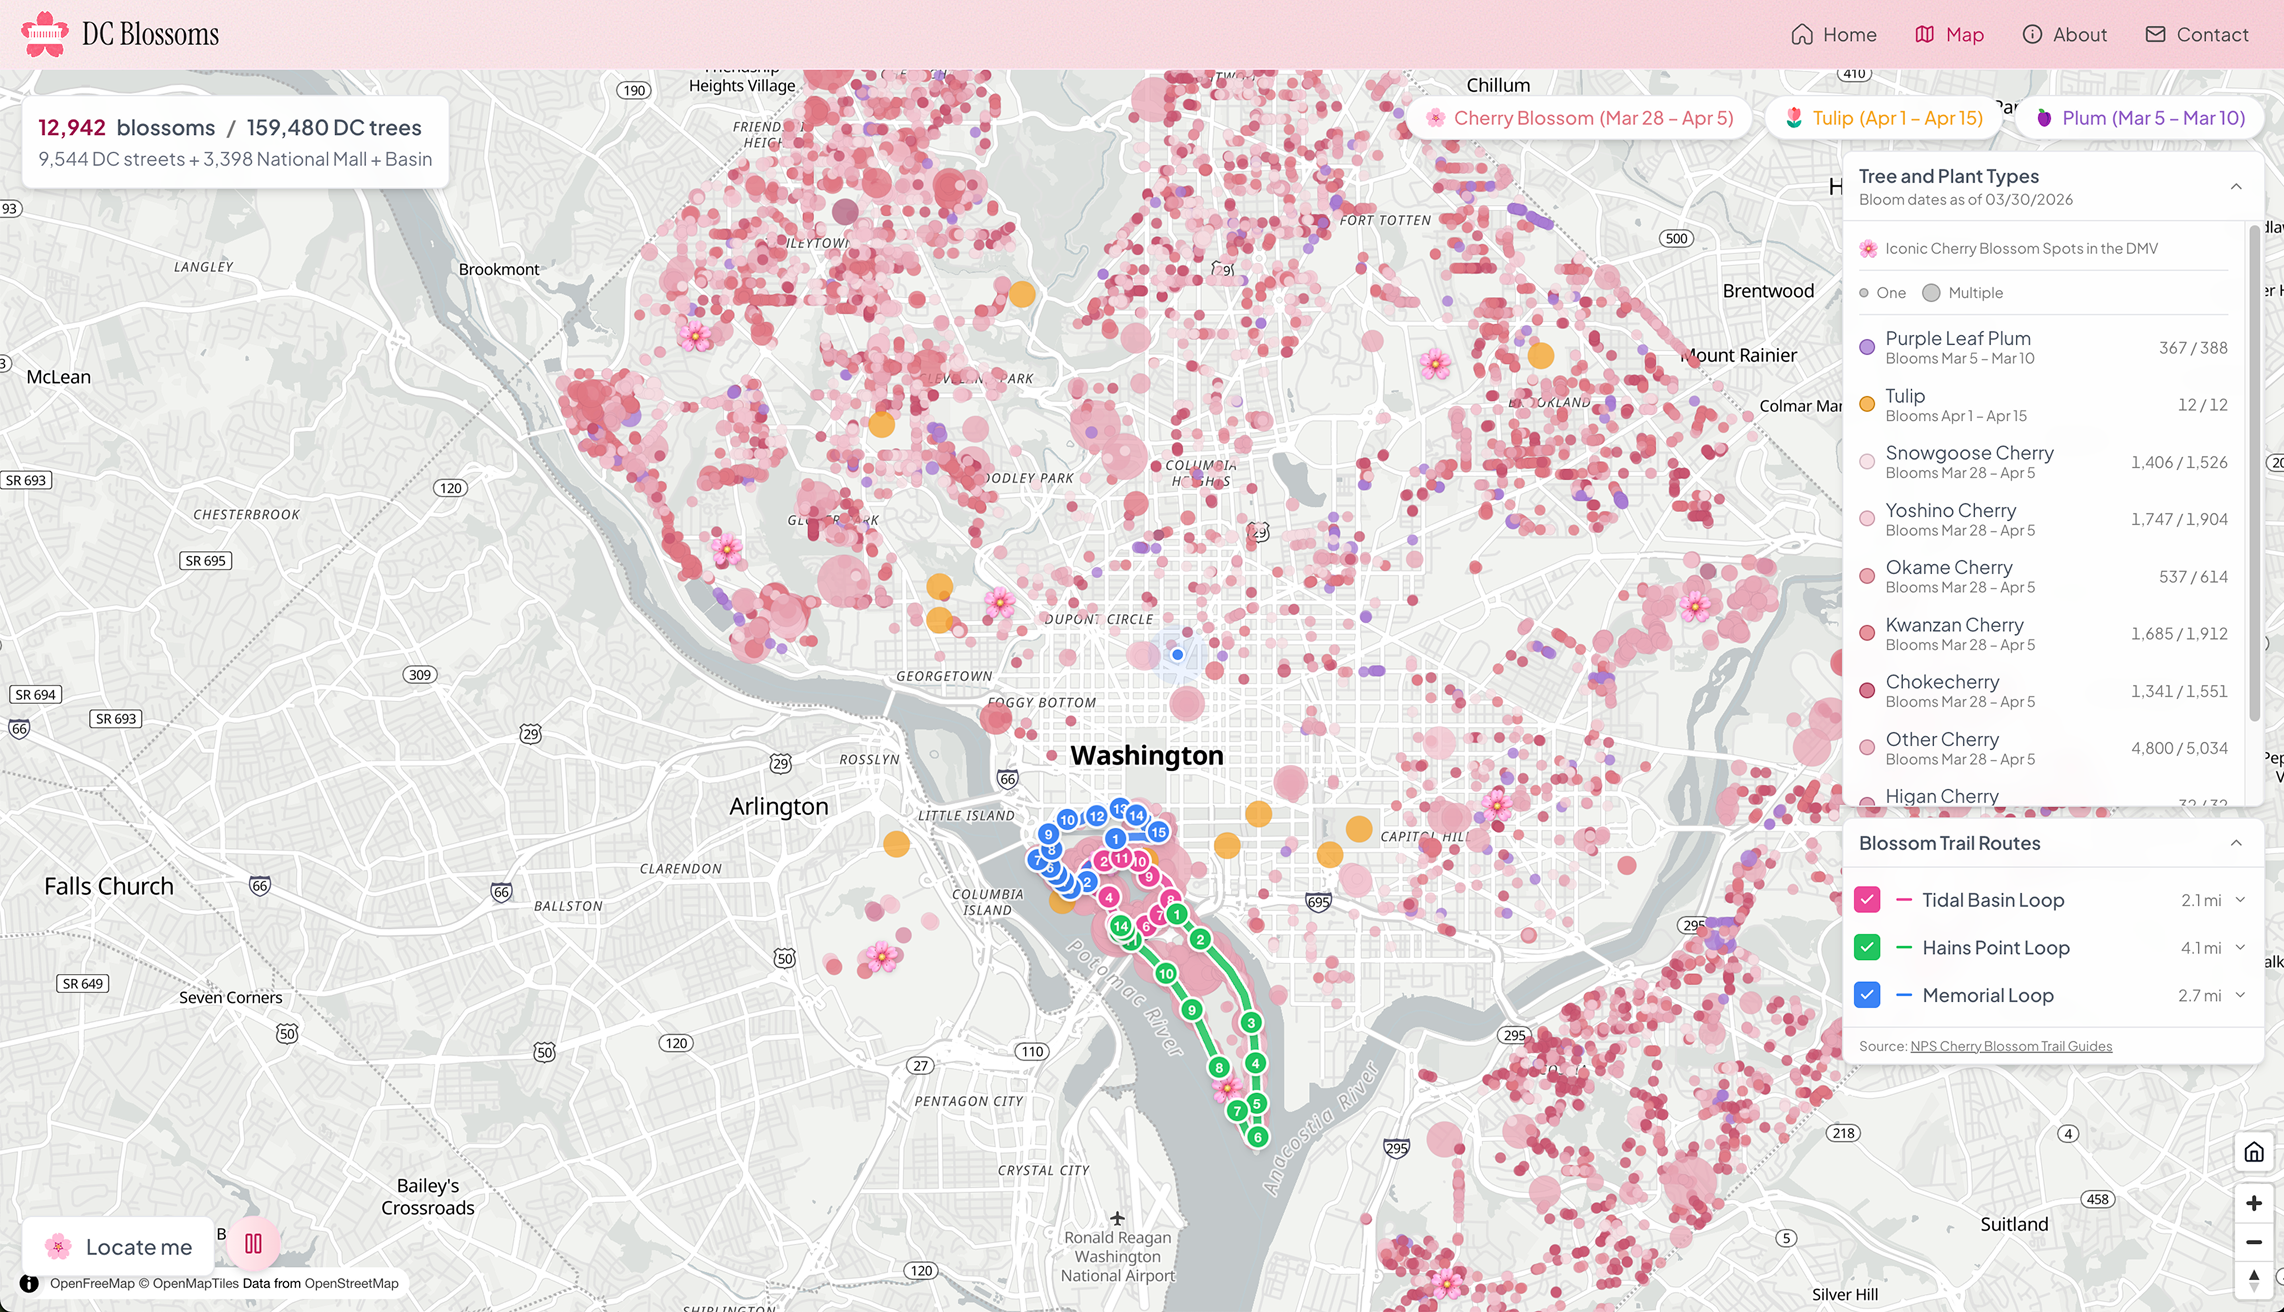
The heart of DC Blossoms was turning scattered bloom information into one map people could actually use.
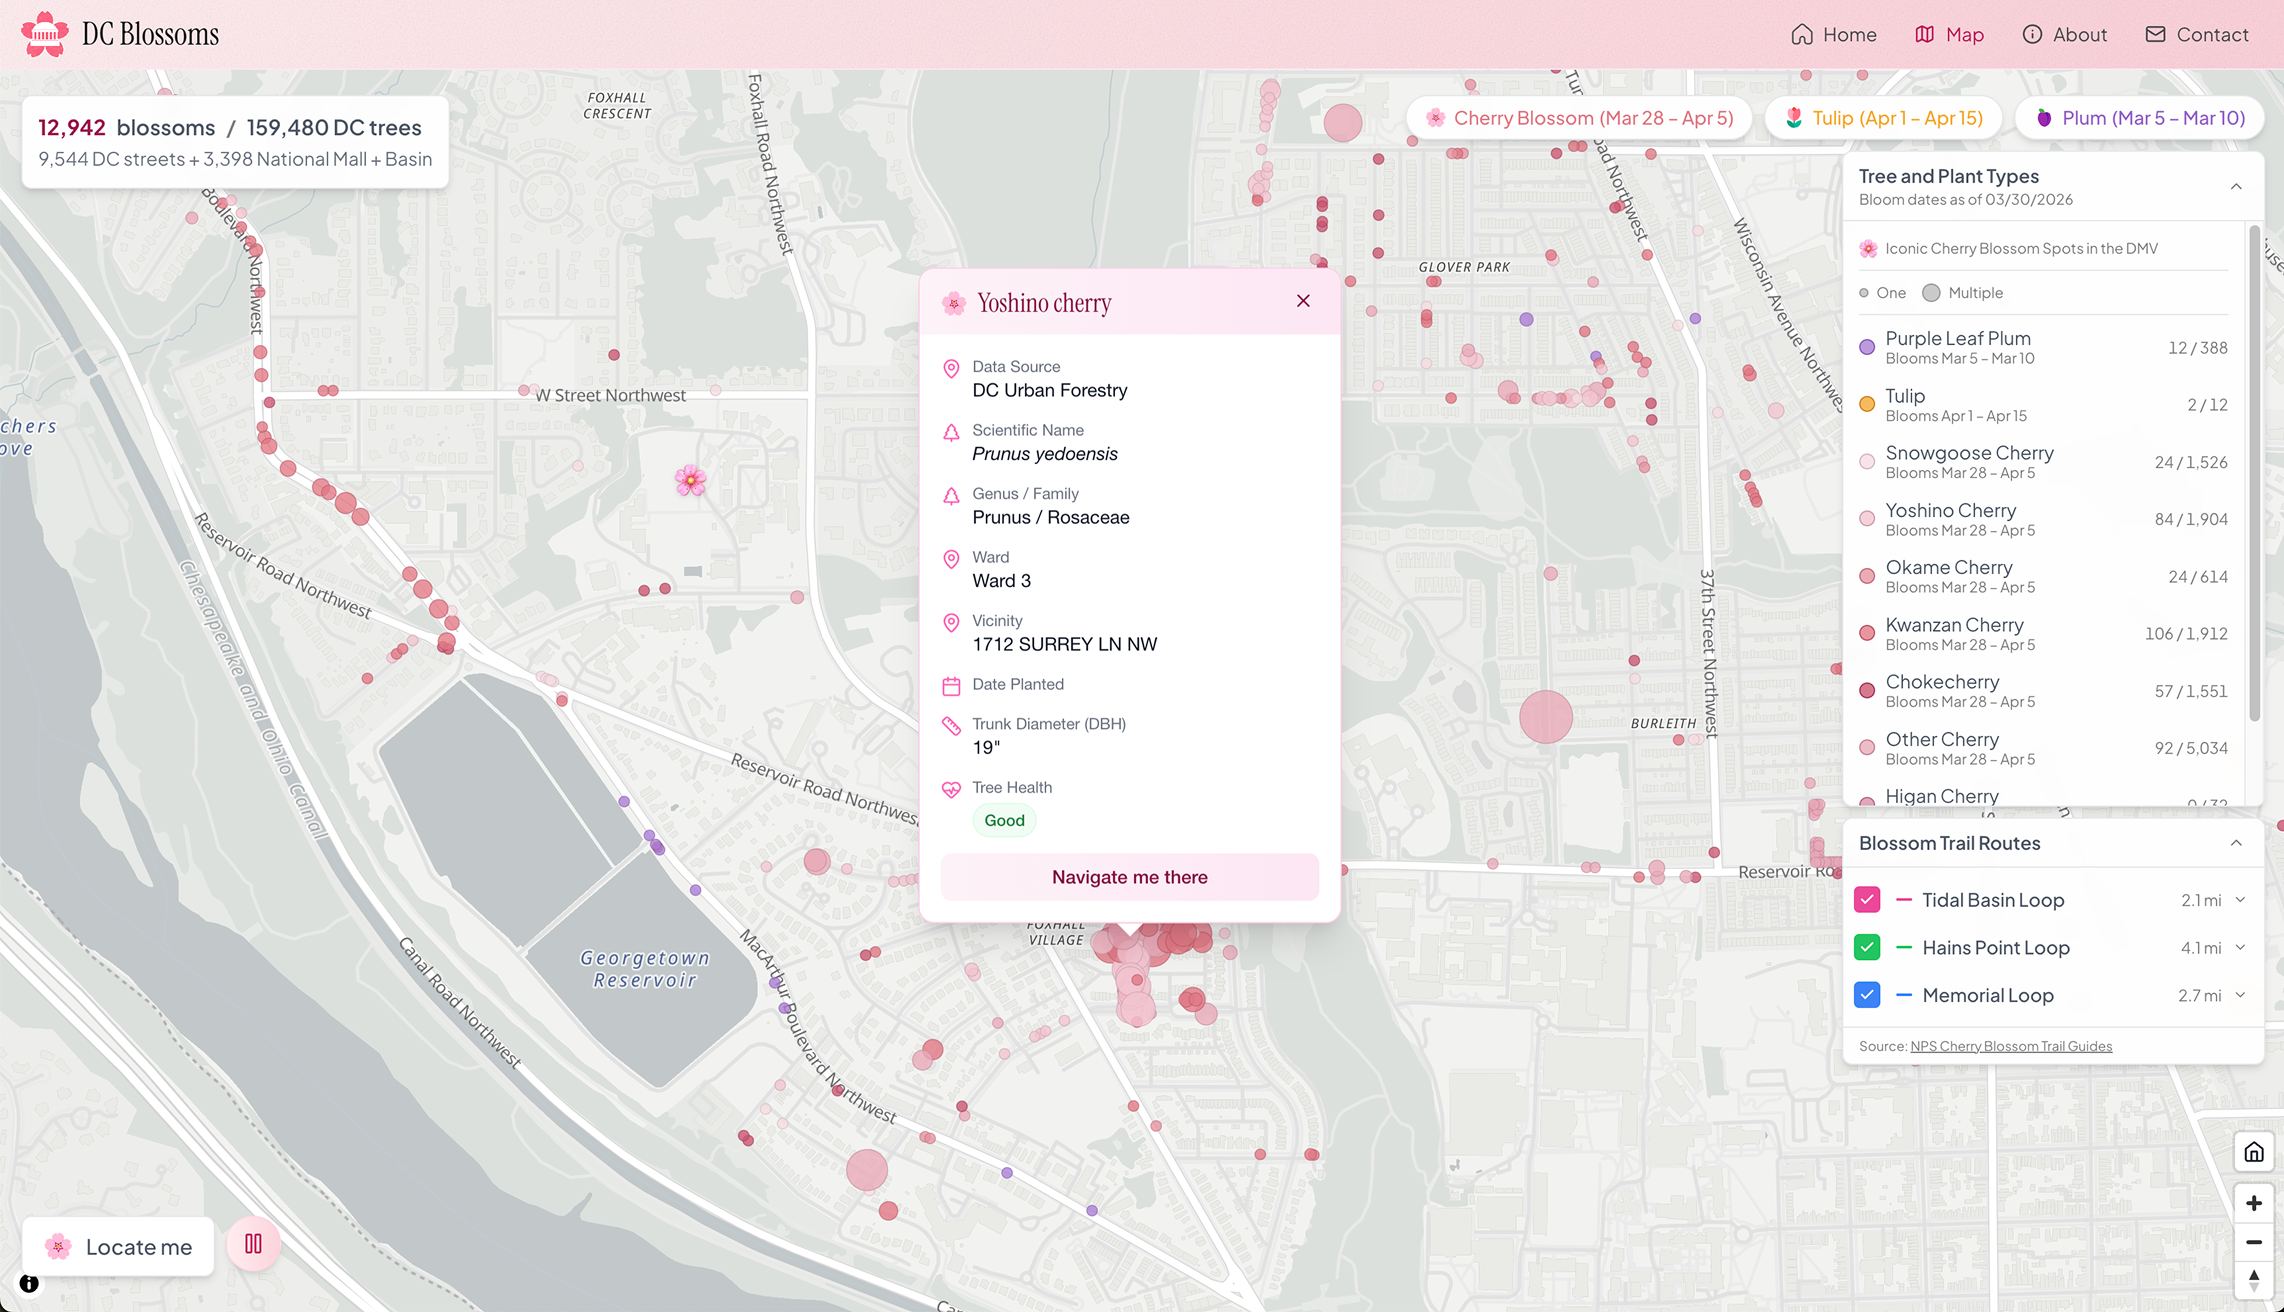
Some of the data came from structured public tree inventories, including DC Urban Forestry Street Trees, NPS Cherry Trees — National Mall & Memorial Parks, U.S. National Arboretum Cherry Trees, and Arlington National Cemetery Cherry Trees. These sources gave me useful fields like species, location, condition, and tree size, but they were not plug-and-play. Each dataset had its own naming conventions, structure, gaps, and quirks.
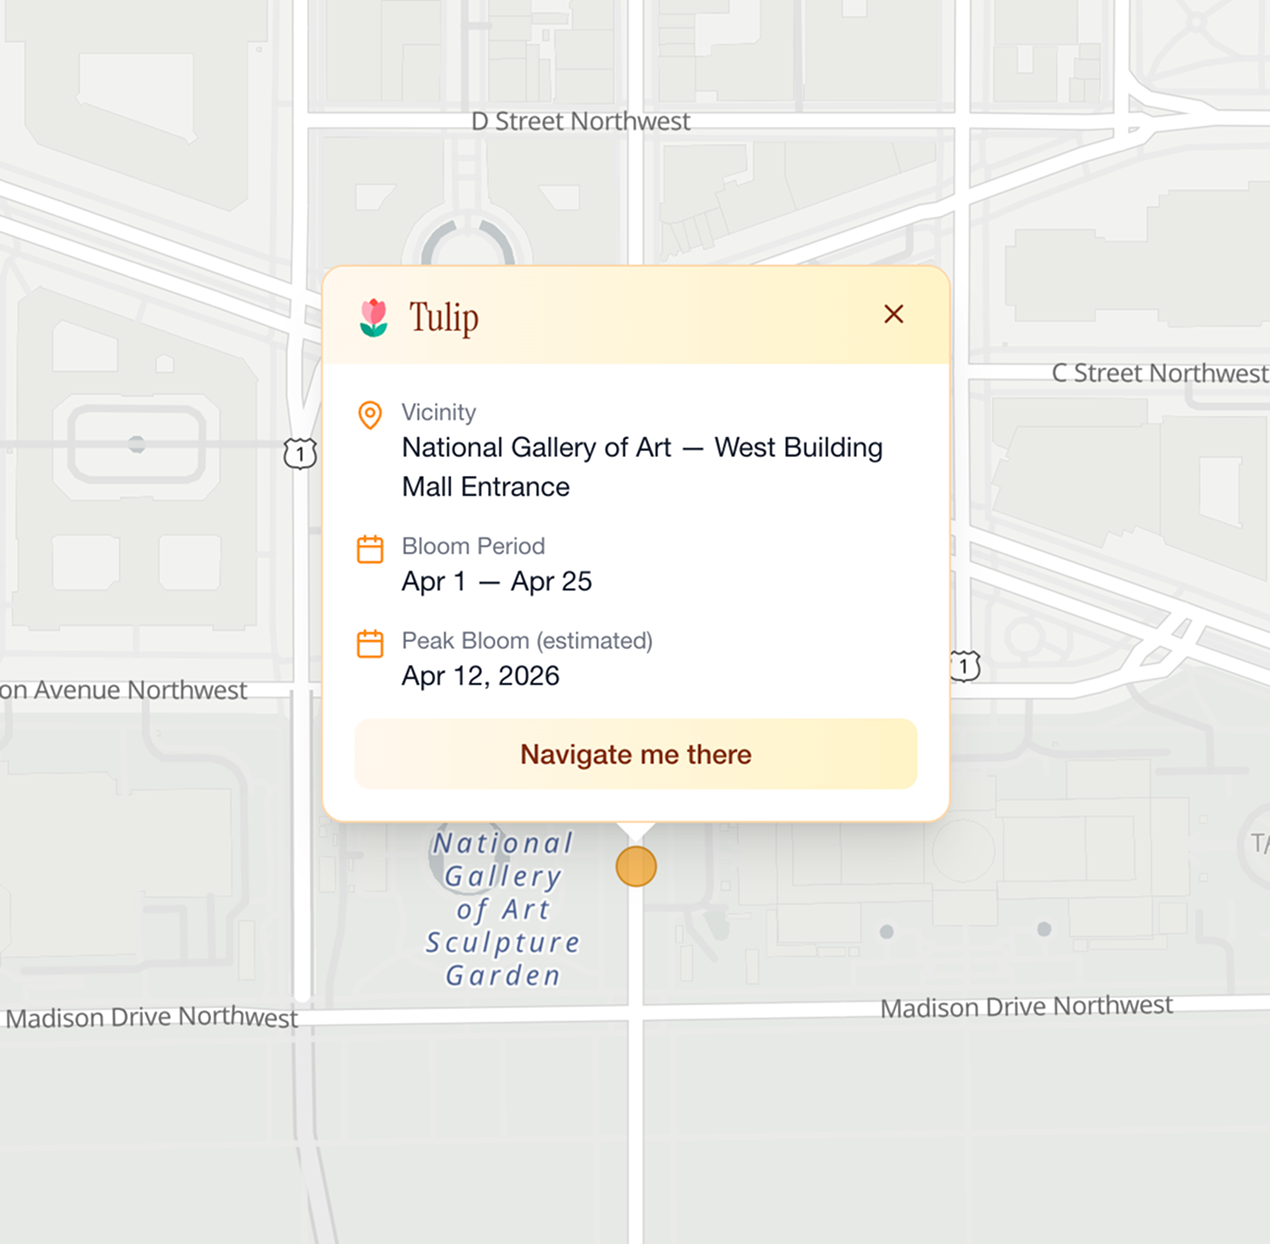
Other parts of the bloom experience were much less structured. Tulips, for example, were not sitting in one clean public inventory. They showed up across garden pages, tourism lists, blog posts, and local recommendations. That layer became more of a curation process: finding reliable bloom destinations, confirming locations, and turning scattered references into mapped points.
The final dataset was a mix of structured records, AI refined data, and human judgment from a DC local herself. It combined public data where it existed, curated information where it did not, and enough cleanup behind the scenes that the final product could feel simple.
The design was shaped by a balance of function and playfulness: the map had to be easy to open, scan, and use on mobile, but still feel charming enough to capture the joy of the season. Small details like falling blossom petals, a blooming intro animation, and soft wind chime audio gave the product a sense of atmosphere without getting in the way of the map itself.
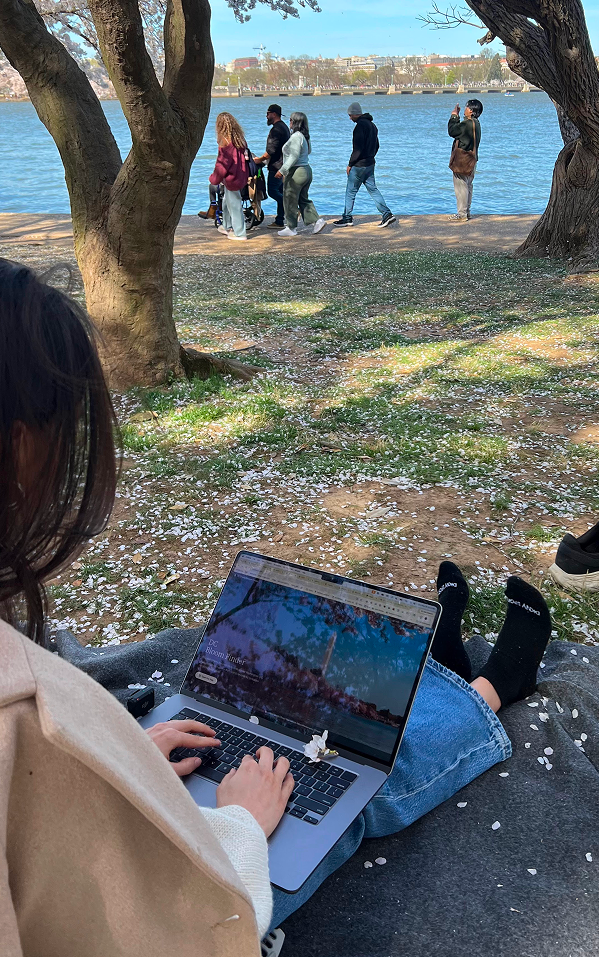
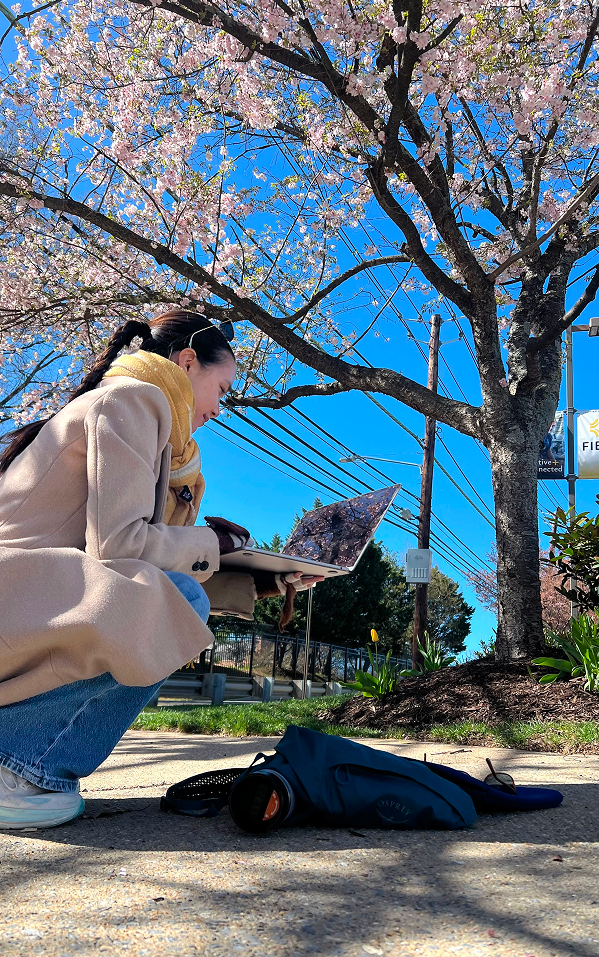
I built DC Blossoms with Next.js, TypeScript, and MapLibre GL, using AI agents including Claude Code and Codex as my partners for implementation. I coded a lot of this project while actually out at the cherry blossoms, including live QA/QC to make sure the data and map matched what was happening on the ground ;)
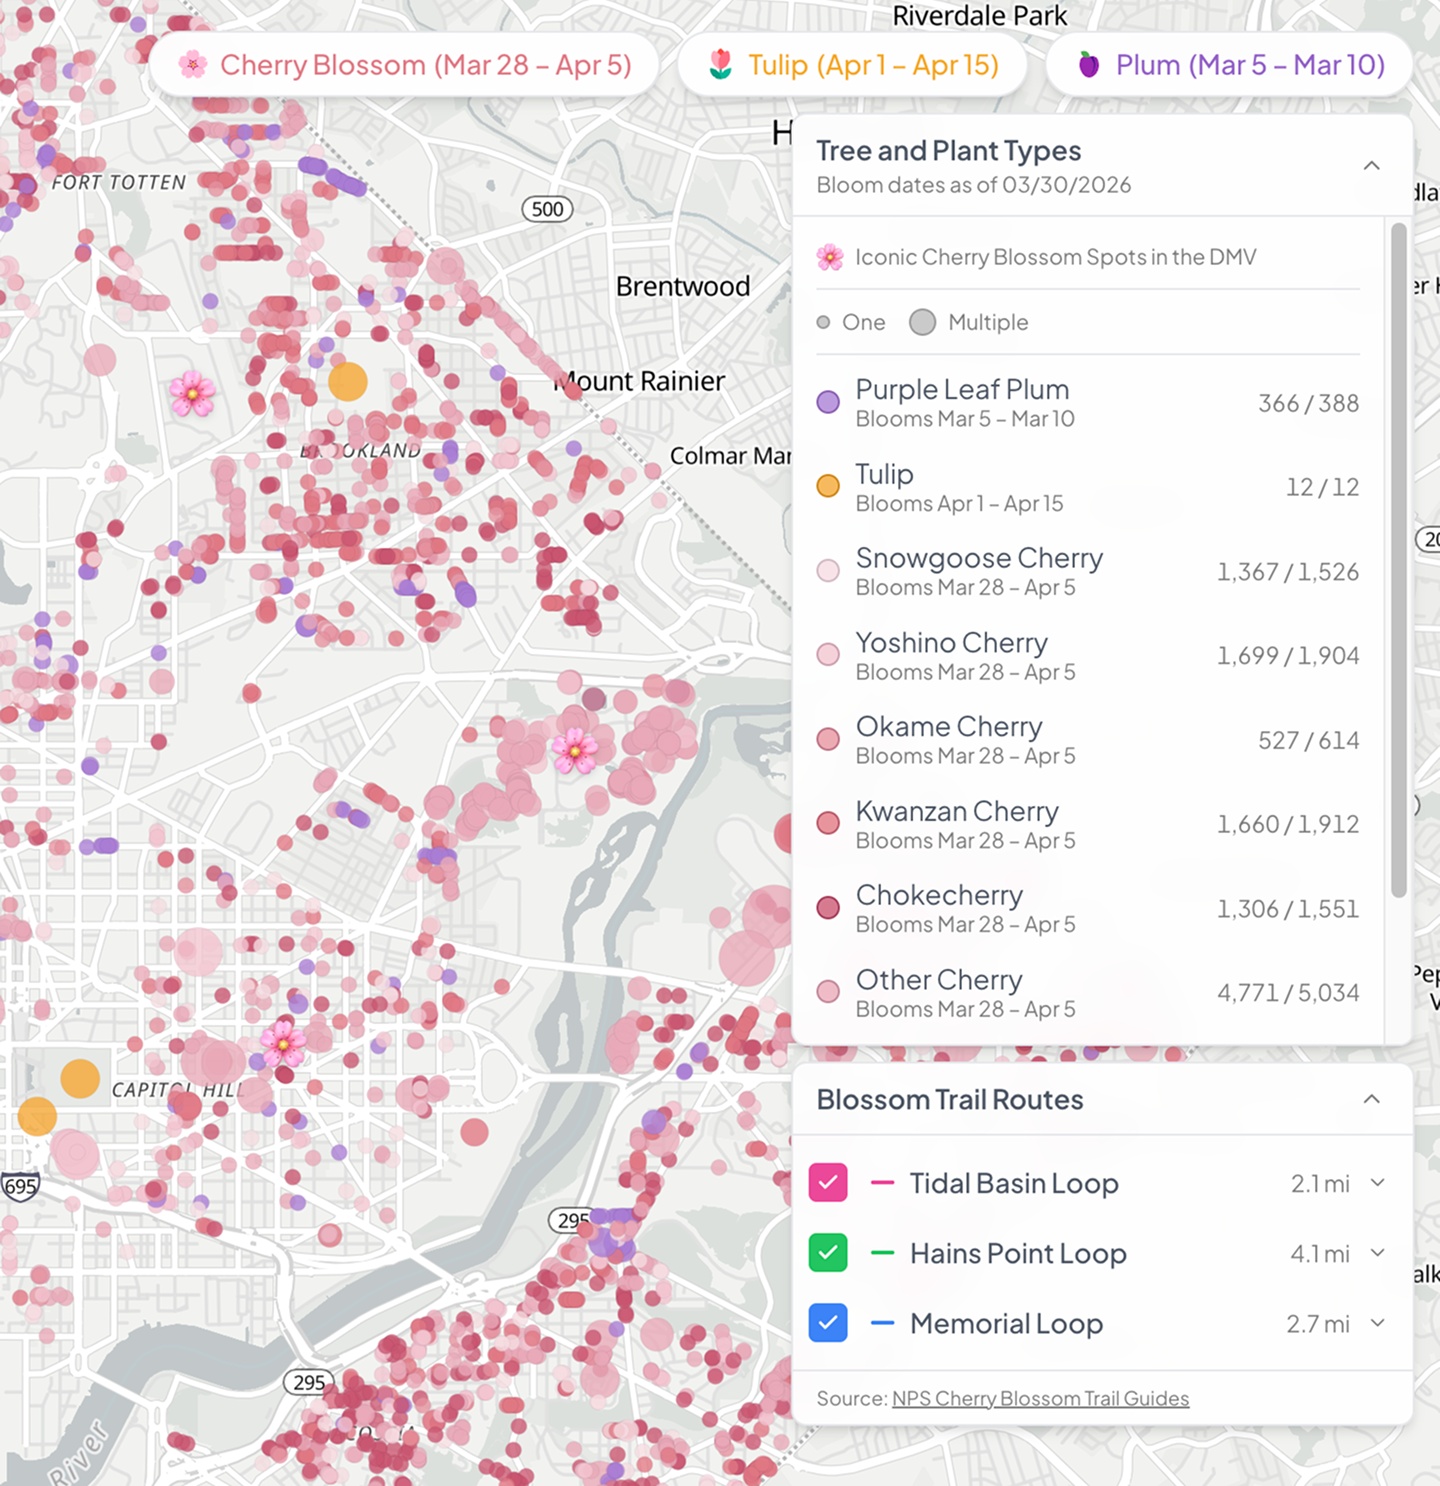
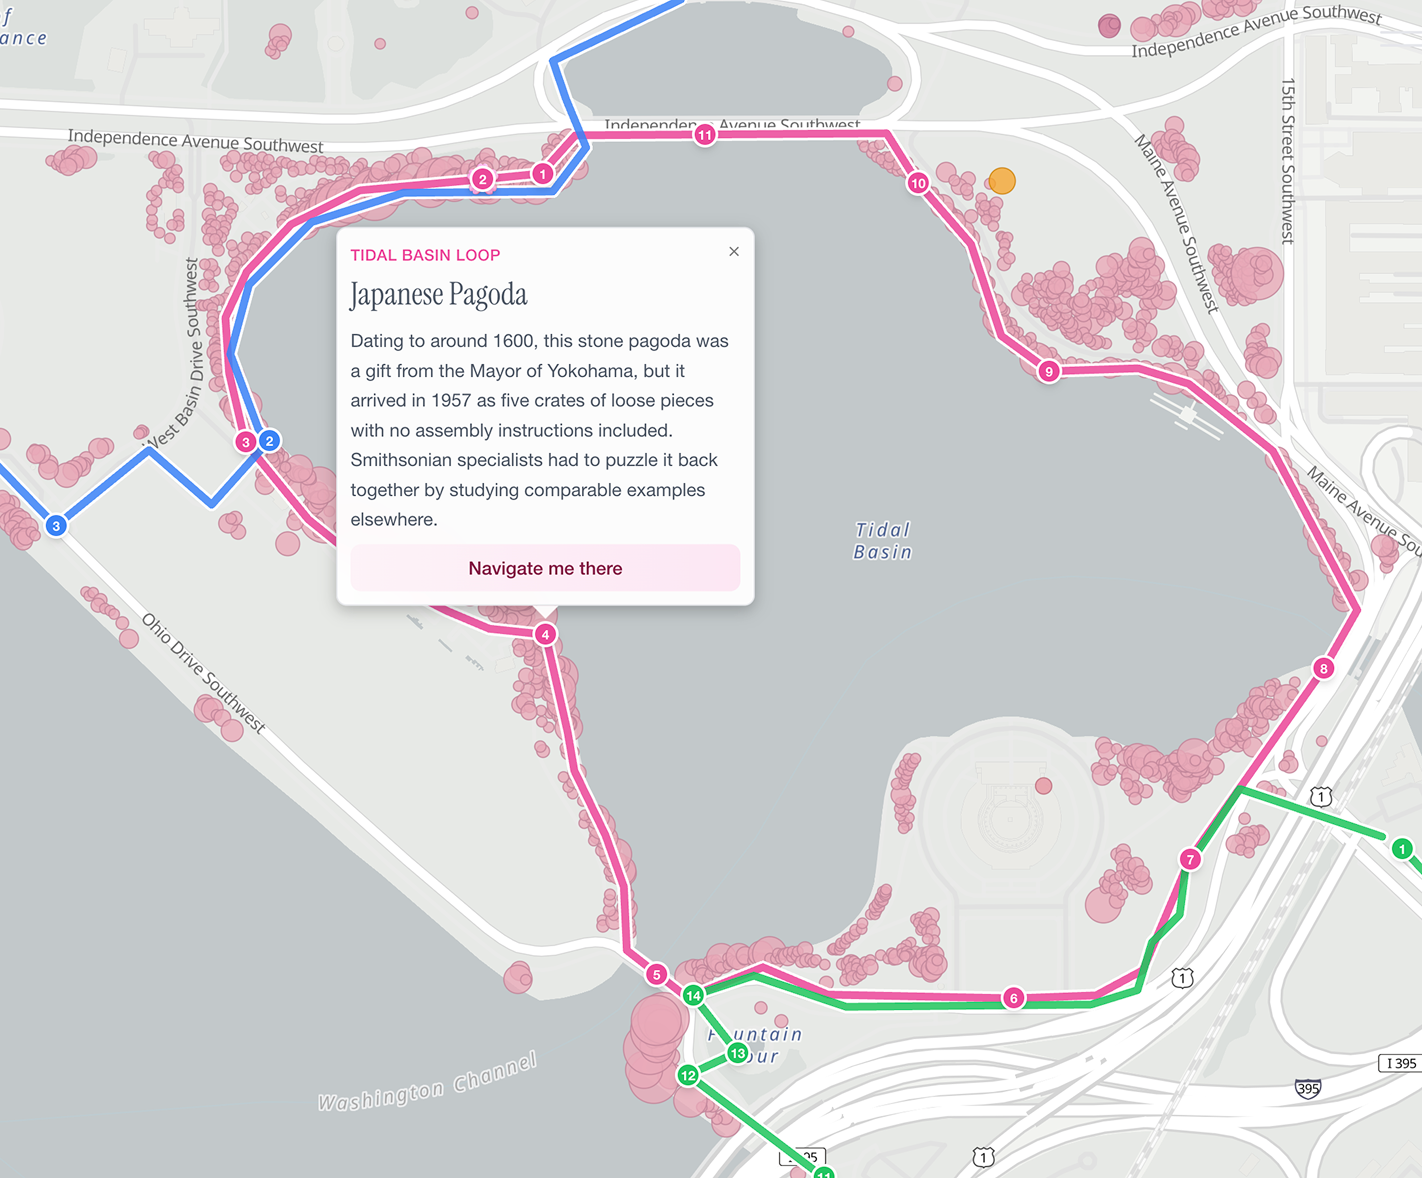
The final product is a public bloom map for exploring cherry blossoms, plum trees, tulips, and other spring bloom locations across D.C. The core experience is simple: open the map, browse mapped bloom spots, filter by bloom type, and find quieter places beyond the Tidal Basin. I also added curated walking routes so the tool could feel less like a database of points and more like a spring guide. 🌸 DCBlossoms.app
DC Blossoms launched as a small public tool and saw real early traction during its first week of launching:
✦ 2,623 views on the launch Instagram Reel
✦ 450 website views